Chapter 4, Image 5
Caption
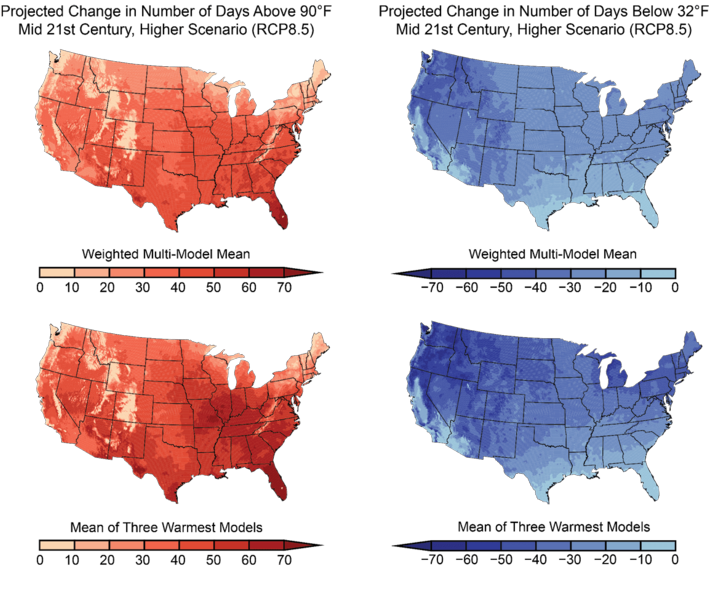
Maps from the 2017 Climate Science Special Report showing projected changes in the number of days that will soar above 90°F (left) or drop below 32°F (right) by the middle of this century (2036–2065, compared to 1976–2005), based on the average result from a variety of climate models using scenario RCP8.5. (U.S. National Climate Assessment/NOAA National Climatic Data Center/Cooperative Institute for Climate and Satellites, North Carolina)