Satellite Applications Virtual Training for Students
During the summer of 2021, the AMS Satellite Meteorology, Oceanography and Climatology (SatMOC) Committee is offering four 90-minute virtual training sessions on satellite data applications. These training sessions will demonstrate how satellite remote sensing data can be used to monitor and analyze weather, ocean, and climate events. Participants will be given the opportunity to complete a "homework" assignment before each session to get better acquainted with the session topic. In addition, participants will be able to communicate with the instructors before and after the live training sessions. The homework assignments and communications with the instructors will be made available on the AMS Community website exclusively for course participants.
June 16, July 7, July 28, and August 11 at 1:00 PM–2:30 PM Eastern Time (Virtual)
| Registration close date: | 3 days prior to each session* |
| Participant cap: | 100 |
* Registration includes Monday through Sunday. See the following schedule of individual registration windows: session on June 16 ends on June 12, session on July 7 ends on July 3, session on July 28 ends on July 24, and session on August 11 ends on August 7.
Registration rates:
There is no fee associated with registering for any of the training sessions.
Registration policy:
This course is being made available to all active AMS members. Registrations are not transferable or exchangeable. The cost of an AMS student membership is $20.
Students may register for either individual sessions or for the complete course (all four sessions). Please use the syllabus to determine which sessions fit your interests and/or schedule.
Course Syllabus:
Open Source Tools for Accessing, Displaying, and Analyzing Environmental Satellite Data
June 16, 1:00–2:30 P.M. EDT
Session description:
Polar-orbiting (LEO) and Geostationary (GEO) satellites routinely sample the atmosphere and create an enormous amount of data that you might want to (or be required to) look at or use. The purpose of this presentation is two-fold: it will familiarize you with websites that display data and will discuss and show tools (with hands-on activities) that you will use to create imagery; it will also introduce you to tools (ERDDAP, Python) that you will revisit in a subsequent sessions with hands-on activities to create imagery.
Schedule:
| 1:00–1:30 | Places where you can find imagery (that is—someone else has done the work for you and created pictures to look at); NOAA Class and ways to display the raw data you find there (most useful if the websites you frequent purge their data) (30 min) |
| 1:30–1:45 | Hands-on activity to create imagery using data from NOAA Class (15 min) |
| 1:45–1:55 | BREAK (10 min) |
| 1:55–2:30 | ERDDAP and Python as tools to manipulate data, with an introductory hands-on activity for both (35 min) |
Analyzing Atmospheric Smoke and Blowing Dust using Satellite Aerosol Optical Depth (AOD)
July 7, 1:00–2:30 P.M. EDT
Session description:
Smoke and dust aerosols in the atmosphere reduce visibility and degrade surface air quality. Smoke plumes originate from large wildfires, seasonal agricultural burning, and prescribed fires for land management. Blowing dust is lofted into the atmosphere from arid surface regions, such as the Sahara Desert. Hazardous impacts from wildfire smoke and dust events have become more frequent and severe in recent years. To help protect public health and welfare, observations of satellite aerosol optical depth (AOD), a quantitative measure of atmospheric aerosols, are used to monitor, assess, and forecast smoke and blowing dust. This session will introduce participants to the Level 2 (L2) AOD products from the ABI sensor on the GOES-16 and -17 satellites and the VIIRS sensor on the SNPP and NOAA-20 satellites. Product characteristics, such as spatial and temporal resolution, will be presented, along with the differences between ABI and VIIRS AOD. Proper use and interpretation of the products will be demonstrated using case study examples of AOD for synoptic and mesoscale smoke and dust events. Participants will use Python in hands-on exercises to 1) download ABI AOD data files for a recent smoke event from the NOAA archive on Amazon Web Services (AWS); and 2) process ABI and VIIRS AOD for the event and visualize the data on professional quality maps. Prior experience with Python is not necessary. Participants will be required to review three short (< 10 min) videos on background material prior to the session.
Schedule:
| 1:00–1:30 | Overview of ABI and VIIRS AOD: Products, Analysis, and Applications (slides) (30 min) |
| 1:30–1:45 | Download ABI AOD data files from AWS: Hands-on with Python (15 min) |
| 1:45–1:55 | BREAK (10 min) |
| 1:55–2:30 | Process and visualize ABI and VIIRS AOD: Hands-on with Python (35 min) |
Monitoring Marine Heat Waves with Satellite Sea-Surface Temperature Data using ERDDAP
July 28, 1:00-2:30 P.M. EDT
Session description:
Satellite measurements of Sea Surface Temperature (SST) are used to detect and monitor changes in SST that can have harmful impacts on marine ecosystems. Coral reefs, for example, are being threatened by global climate change. First observed in the early 1980s, mass coral bleaching has become one of the most visible and damaging marine ecological impacts of persistently rising ocean temperature. Recently, marine heat waves have been occurring across the Pacific Ocean, which have disrupted the food supply for some species and led to the development of massive harmful algal blooms which shut down the harvest of crab and shellfish along the west coast. In this session we will use SST anomaly data to visualize the extent of the marine heat wave both spatially and temporally. We will be accessing level 3 data served on ERDDAP, a data delivery system developed at NOAA/SWFSC/ERD and which is used extensively by NOAA’s CoastWatch program to distribute oceanographic satellite products. Other oceanographic satellite products such as ocean color (chlorophyll), sea-surface height, surface vector winds, and salinity are also available from ERDDAP. Prior experience with ERDDAP is not necessary. Participants will be required to review some short (< 10 min) videos on background material prior to the session.
Schedule:
| 1:00–1:30 | Introduction to Marine Heat Waves; Introduction to ERDDAP (30 min) |
| 1:30–1:45 | Visualize and download SST anomaly data: Hands-on with ERDDAP (15 min) |
| 1:45–1:55 | BREAK (10 min) |
| 1:55–2:30 | Data exploration: Hands-on with ERDDAP (35 min) |
Monitoring Changes in Sea Ice at Seasonal and Near-Real-Time Time Scales
August 11, 1:00–2:30 P.M. EDT
Session description:
The amount of sea ice has been steadily decreasing under global climate change and melting of this ice is a major contributor to sea level rise. Satellite observations of sea ice date back to the 1970’s and having this long time series of data enables us to see these long-term trends. In addition to its uses in climate studies, sea ice data is valuable information for the shipping and transportation industries, which need to have this information in near-real time. We will explore the different types of sea ice products available from satellite data as well as the array of satellite sensors that make these measurements. There are a number of different data providers that serve different types of users. We will cover the data holdings of the National Sea and Ice Data Center (NSIDC), the National Ice Center (NIC) and NOAA’s PolarWatch.
Schedule:
| 1:00–1:30 | Introduction to Satellite Sea Ice Products (30 min) |
| 1:30–1:45 | NIC and NSIDC Data Products (15 min) |
| 1:45–1:55 | BREAK (10 min) |
| 1:55–2:30 | Data exploration: Hands-on with PolarWatch (35 min) |
Instructors:

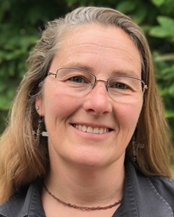
Cara Wilson
NOAA/NMFS/SWFSC
Cara Wilson is a satellite oceanographer for the Environmental Research Division (ERD) at NOAA’s Southwest Fisheries Science Center in Monterey CA and is the PI of two regional nodes of NOAA’s CoastWatch program—the West Coast Regional Node and PolarWatch, which are both housed at ERD.

Amy Huff
IMSG at NOAA/NESDIS/STAR
Dr. Amy K. Huff is a Senior Research Scientist at I.M. Systems Group, a contractor for the NOAA NESDIS Center for Satellite Applications and Research (STAR). She has a Ph.D. in chemistry from the University of California at San Diego and a M.S. in meteorology from Penn State. Currently, Dr. Huff is the outreach representative for STAR's aerosol and atmospheric composition science team. She acts as a liaison to satellite data end users and promotes utilization of satellite products through training sessions and social media. Her research involves air quality applications of aerosol and trace gas observations from geostationary and polar-orbiting satellites.
Find her on Twitter: @AerosolWatch

Scott Lindstrom
CIMSS at the University of Wisconsin-Madison
Scott Lindstrom is an Information Technologist and trainer at the Cooperative Institute for Meteorological Satellite Studies (CIMSS) at the University of Wisconsin-Madison. The best part of his job is looking at beautiful satellite imagery every day and describing how its use can help in the forecast process. This is done both in writing on blogs and in training webinars. He holds a B.S. in Meteorology (and one in Computer Science) from Penn State, and an M.S. and Ph.D. in Meteorology from the University of Wisconsin-Madison.
Find him on Twitter: @WxSatChat.
Working Group:
A Working Group on Virtual Training was formed by the AMS Satellite Meteorology, Oceanography and Climatology (SatMOC) Committee with the purpose of teaching and sharing new satellite observations and developments that are not in textbooks as well as enriching and strengthening student skills to use satellite data to examine and/or study extreme events. Its members are acknowledged below:
- Jordan Gerth (NOAA/NWS)
- Eric Goldenstern (Colorado State University)
- Amy Huff (IMSG at NOAA/NESDIS/STAR)
- Scott Lindstrom (University of Wisconsin SSEC/CIMSS)
- Gary McWilliams (Science and Technology Corporation, NOAA)
- Sherrie Morris (NOAA)
- Bill Sjoberg (NOAA JPSS)
- Sara Tucker (Ball)
- Jun Wang (University of Iowa)
- Cara Wilson (NOAA/NMFS/SWFSC)