-
- AMS_ClimateChange_355.png
-
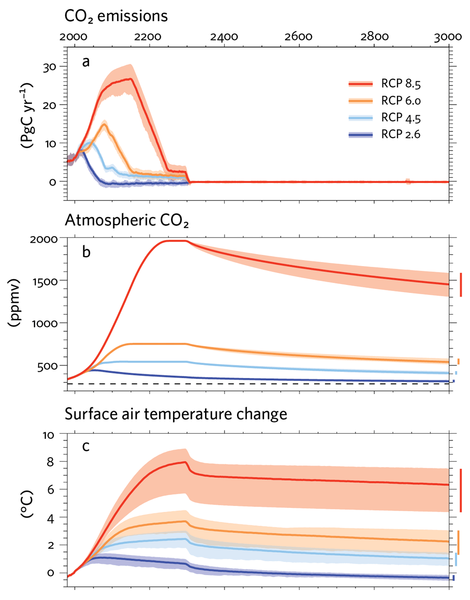
Earth system models of intermediate complexity (EMICs) are detailed enough to capture important processes, yet simplified enough so that very long-term simulations are feasible. This graphic shows how EMIC runs carried out in support of the 2013 IPCC assessment depict three key variables over the next thousand years—carbon dioxide emissions (top), CO2 concentrations (middle), and global surface air temperature (bottom)—for each of the four IPCC emission pathways, or RCPs. Temperature change is relative to the period 1986–2005. To determine the total temperature change since preindustrial times (1850–1900), add roughly 0.6°C (1.1°F). See p. 16 for RCP details. Shaded bands show the range for each model ensemble, with each solid line denoting an ensemble mean. The abrupt temperature drop in 2300 is a result of eliminating all CO2 emissions and non-CO2 forcing factors. (IPCC)
-
- AMS_ClimateChange_365.png
-
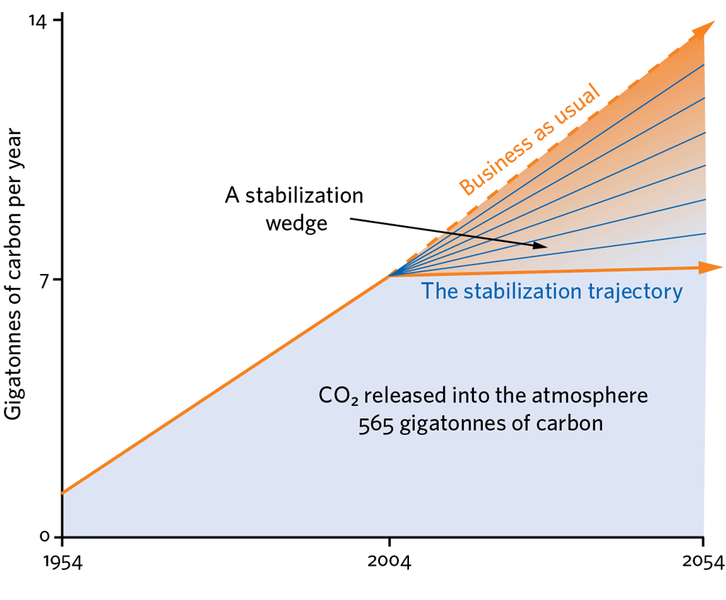
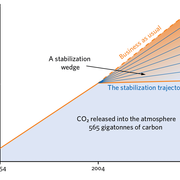
The original wedge-strategy diagram, as conceived by Stephen Pacala and Robert Socolow.
-
- AMS_ClimateChange_360.png
-
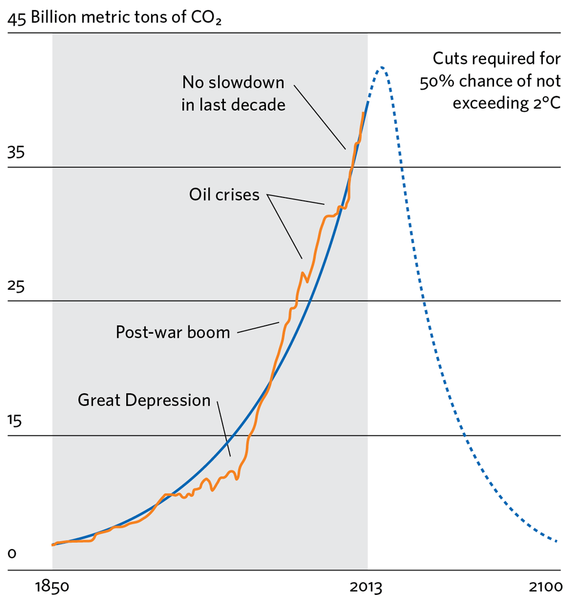
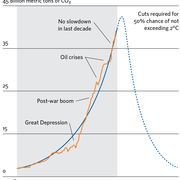
CO2 emissions since 1850 (orange), exponential growth (blue), and cuts to hit climate target (dashed). (Duncan Clark/The Burning Question)