Click image for full resolution
Click image for full resolution
|
Click image for full resolution |
Click image for full resolution |
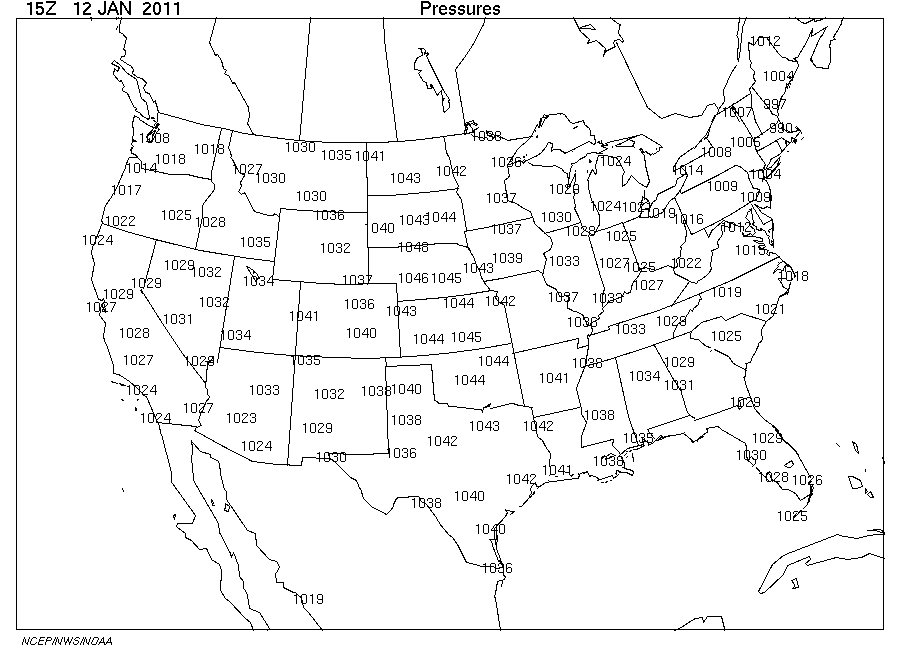
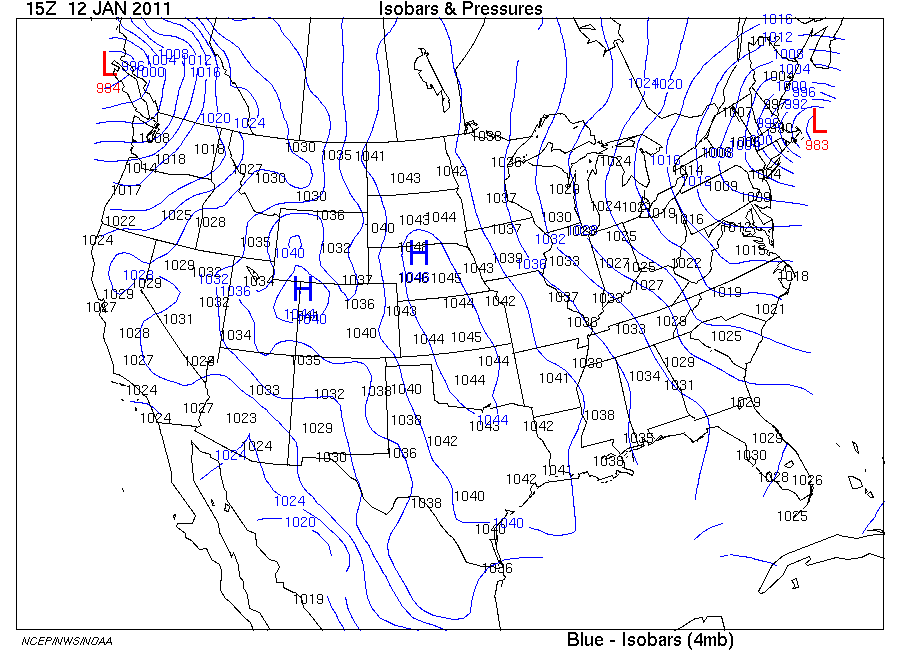
| Click here for latest Pressures map from website | Click here for latest Isobars & Pressures map from website |
The latest available pressures on both maps are in whole (integer) millibars at the UTC time and date displayed in the upper left margin. Stations for which the pressure values are given are considered centered on the number. To identify the stations, see Available Surface Stations. Pressures are "sea-level pressures" - those measured by a barometer at the site ("station pressure"), which are then reduced to sea level (0 meters elevation). This correction removes the dependence of pressure on the altitude of the measuring station leaving the pressure distribution related to the large scale weather systems.
Isobars (map on right) are blue lines which
connect equal pressure values based on the set from
1000 mb
with an interval of 4 mb above or below that. Isobar
values are labeled in blue within
the isobar lines that are contained in the map area. Additionally,
centers of locally highest and lowest pressures are marked by a blue H
and red L, respectively.
| Back to Contents |