A note about accessibility: When preparing your figures, please select color palettes that effectively convey the meaning of the figure but are legible for readers with color vision impairment. Further guidance can be found in the Accessibility section.
On this page:
Accepted Figure File Types
| Extension | File type | Description |
|---|---|---|
| AI | Adobe Illustrator | Can contain vector and raster information. Save with fonts embedded. |
| CDX, CDXML | ChemDraw Exchange | Popular molecule editor application. |
| EPS | Encapsulated PostScript | Can contain vector and raster information. Save with fonts embedded. |
| JPEG | Joint Photographic Expert Group | Raster file format that uses an adjustable lossy compression system. This means in order to achieve smaller file sizes some quality is lost. If Max or High quality settings are used, then JPEG is an acceptable format for print and online. |
| PPT/ PPTX | Microsoft Power Point | Can contain either vector or raster information. Use standard fonts (base 14) to avoid potential delays due to missing fonts. |
| DOC/ DOCX | Microsoft Word Document | Same as above. |
| XLS/XLSX | Microsoft Excel Spreadsheet | Same as above. |
| Portable Document File | Can contain vector and raster information. Use high-resolution/high-quality compression settings when created. Save with fonts embedded. | |
| PNG | Portable Network Graphics | Raster file format very similar to JPEG. |
| PSD | Adobe Photoshop Document | Native file format of popular image editor. |
| TIFF | Tagged Image File Format | Raster image file format. |
Raster Images
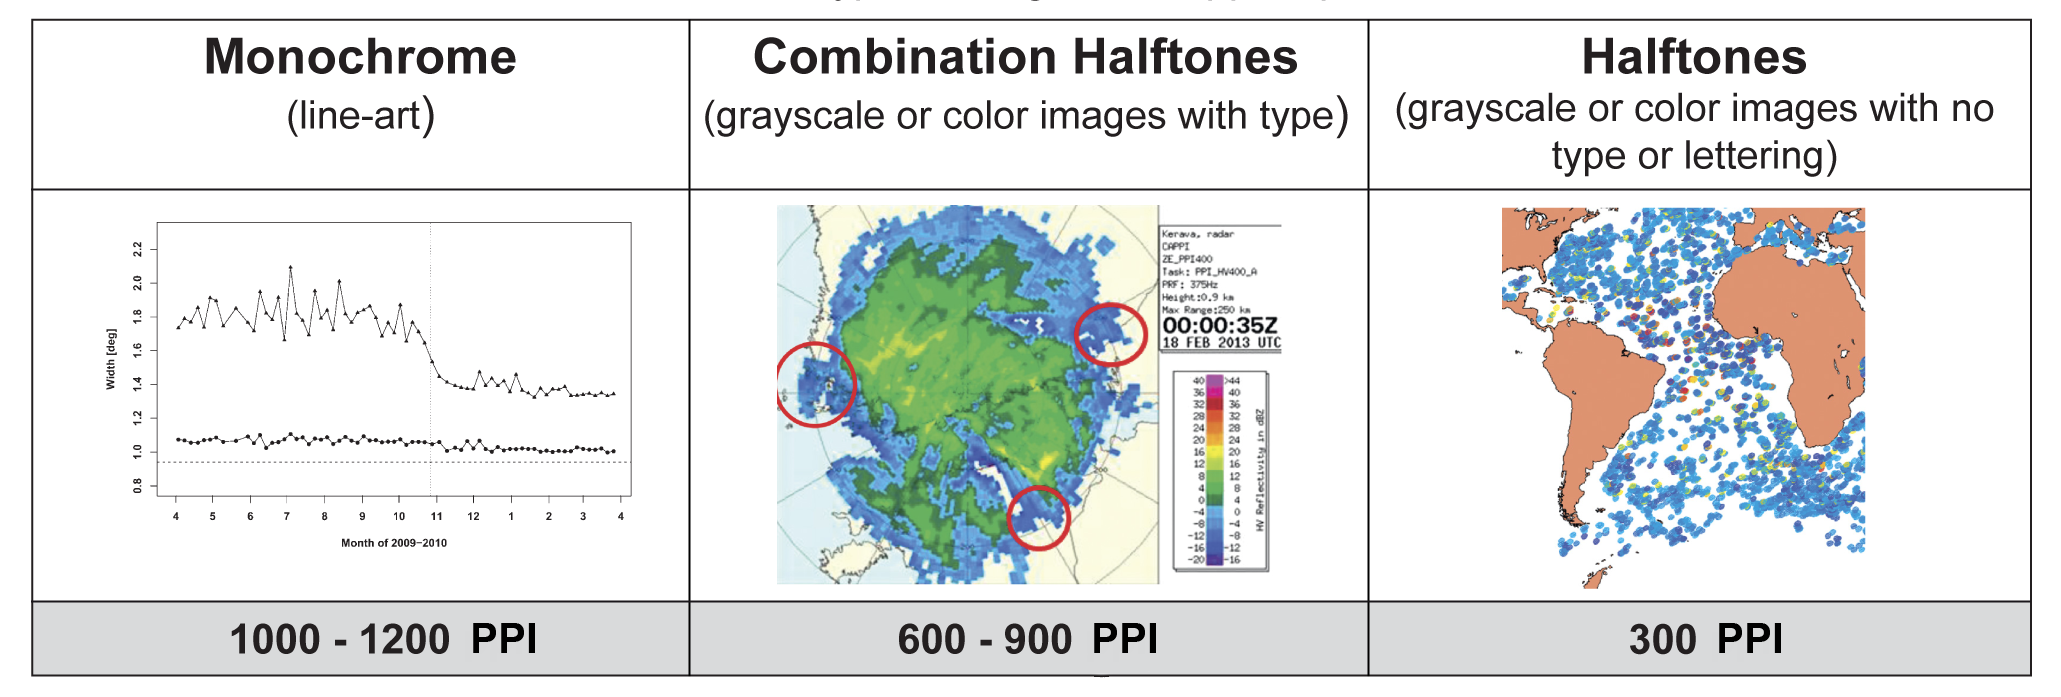
Low-resolution images are one of the leading causes of art resubmission and schedule delays. Submitted raster (i.e., pixel based) images must meet the minimum resolution requirements. Raster images can be classified as monochrome (line art), halftone, or combination halftone. Some of the common raster file formats that cannot be accepted are GIF, BMP, and PS.
- Monochrome (1 bit) images: Common examples are graphs and charts made of solid black and white with no gray values. The preferred resolution is 1,000–1,200 PPI at publication size.
- Combination halftone: Common examples are color or grayscale figures containing halftone and line-art elements. The preferred resolution is 600–900 PPI at publication size.
- Halftone: Common examples are color or grayscale figures containing images only with no text or thin lines. The suggested minimum resolution is 300 PPI at publication size.
Vector Images
Vector images are typically generated using drawing or illustration programs (e.g., Adobe Illustrator) and are composed of mathematically defined geometric shapes—lines, objects, and fills. Vector graphics are resolution independent and can be sized up or down without quality loss.
- Use the same font for all figures. Standard fonts include Arial, Helvetica, Times, Symbol, Mathematical Pi, and European Pi.
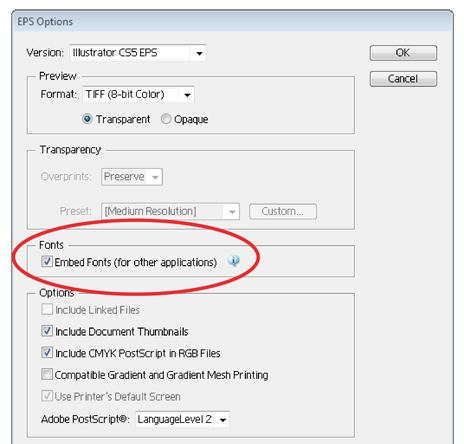
- Vector line art: Common examples are graphs and charts created in illustration programs. It is preferable to save them as EPS files, with all fonts embedded, and graph lines at least 0.25 points wide. If you are using Illustrator, check the box that reads Embed Fonts when saving the file.
- Combination line/halftone: Quite often authors will insert raster images into a vector drawing program (e.g., Adobe Illustrator) to add text and labels. Assuming the inserted raster image(s) meets the required resolutions, save these combination files as an EPS with all fonts converted to outlines and graph lines at least 0.25 points wide.
Microsoft Office Images
PowerPoint slides, Excel graphs, or images embedded in Word are acceptable formats. When creating the original file in a Microsoft Office application, follow these general rules to ensure that the initial file is properly prepared:
- Do not use patterned or textured fills in graphics. Instead, use solid fills or percentage screens that can be effectively converted to vector images. Note: A 20% difference in percent screens is most effective for differentiation.
- Artwork placed within any Microsoft Office application must be of an acceptable minimum resolution for print production: 300 PPI for tones, 600–900 PPI for combinations, and 1,000–1,200 PPI for line art.
- When inserting pictures/images into files, select “insert” (not “insert link”) to properly embed the high-resolution image into the Microsoft Office file.
- Use the same font for all figures. Standard fonts include Arial, Helvetica, Times, Symbol, Mathematical Pi, and European Pi.
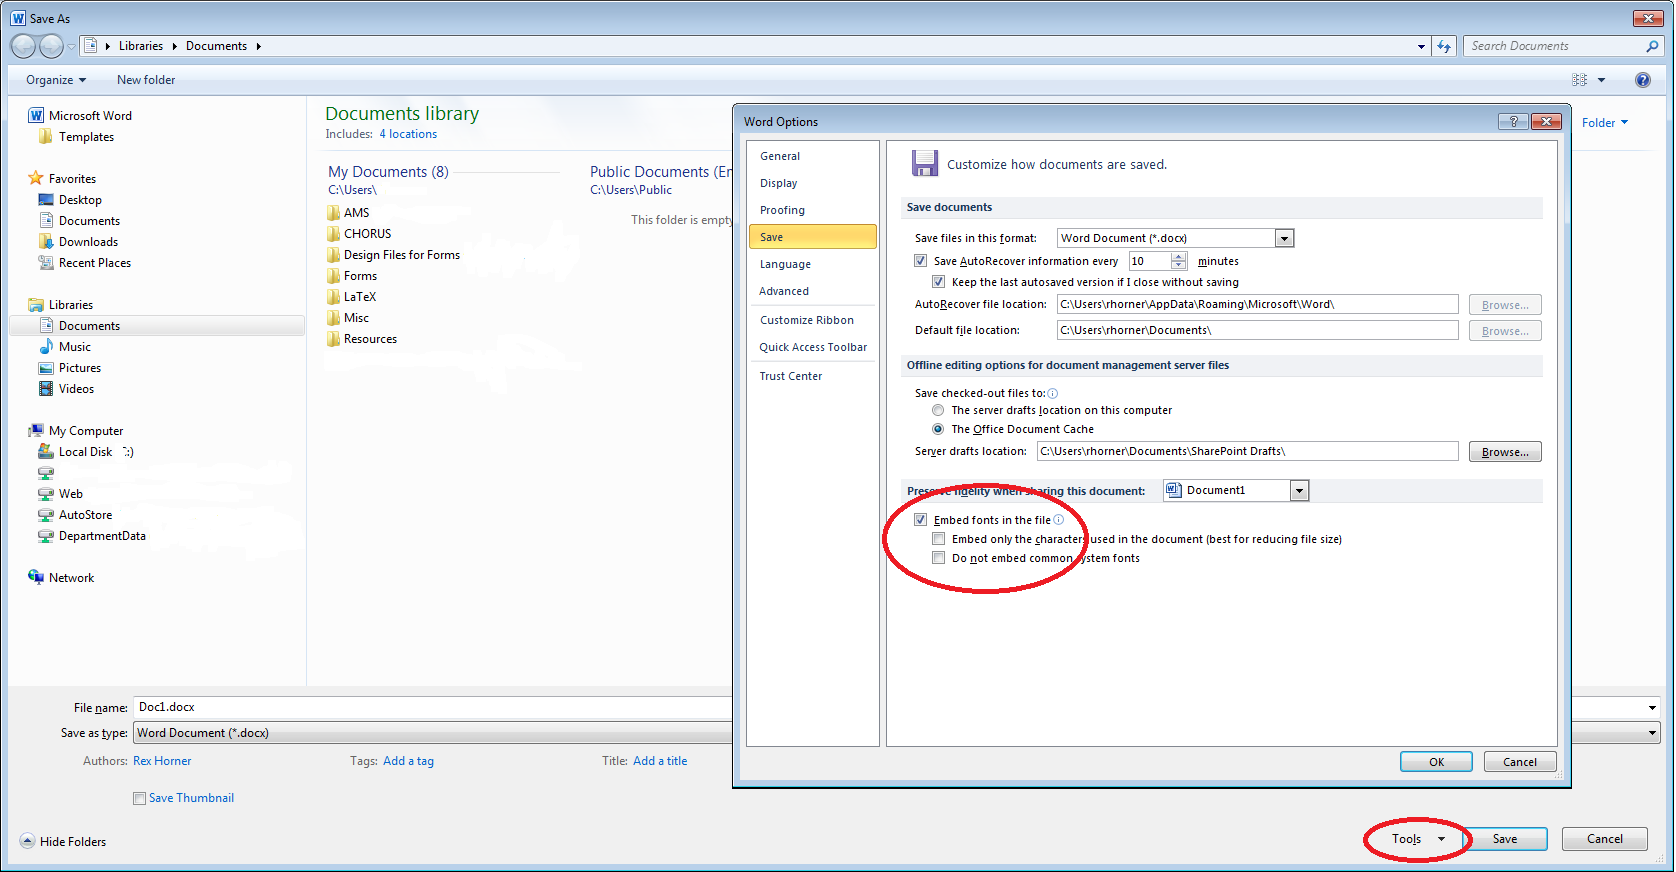
- Always embed fonts in your documents.
- From the file menu, select Save As…
- From the Tools menu, select "Save Options...", then select the "Embed fonts in the file" checkbox. Do not select either of the following checkboxes. The screenshot below is taken from MS Word 2010 for Windows.
Color Mode (RGB and CMYK)
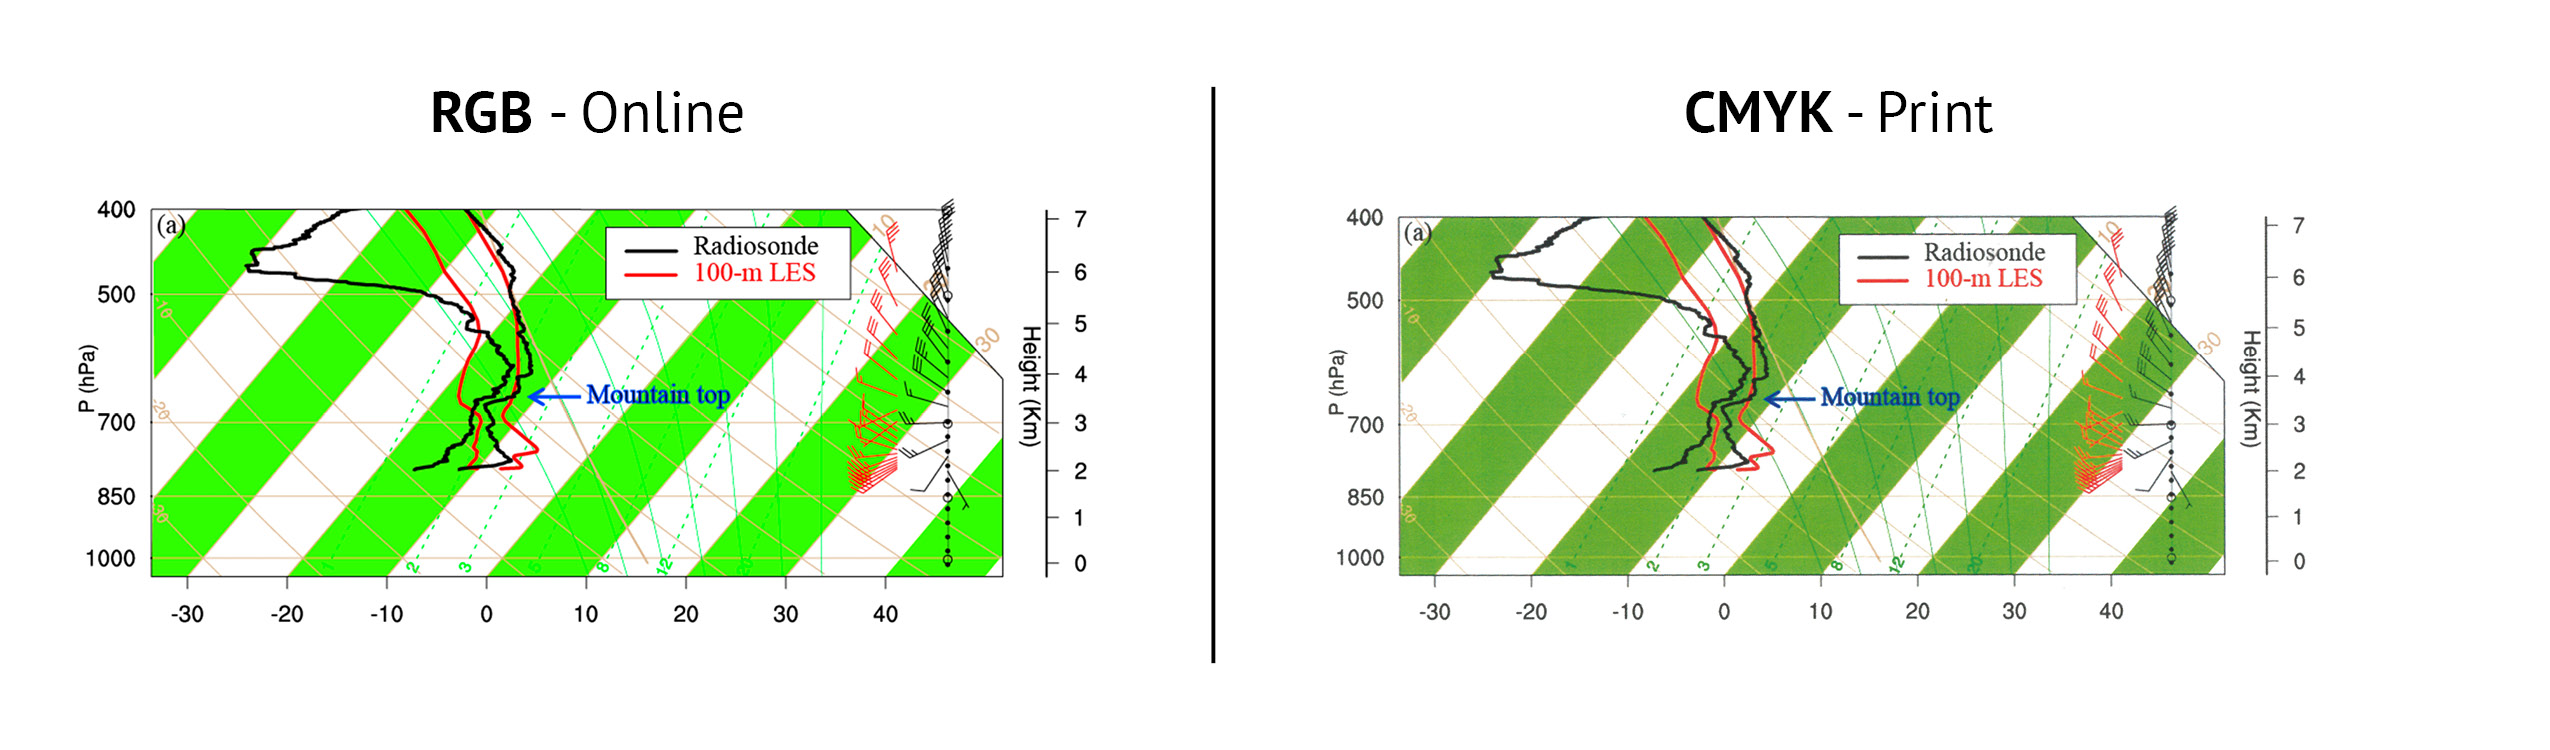
All color image files must be submitted in their original RGB color. This will ensure that the brightest possible RGB colors will show online, as the RGB color space (light based) is capable of producing more saturated colors than the CMYK (ink based) color space. Please be aware that some colors may become destaturated when figure images are converted to CMYK for print. This occurs most significantly with bright greens, oranges, and blues, as seen in the example below.
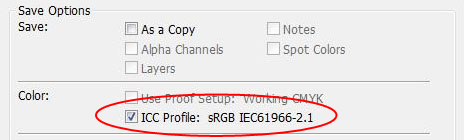
To ensure the best possible conversion to CMYK for the printed journal, when you work with raster images, use an application that supports ICC profiles, such as Adobe Photoshop. Be sure to always embed the originating ICC profile when saving the file. This is usually the default behavior. For example, this screen shot is from the "Save As..." dialog box in Photoshop. The box to embed the ICC profile is checked by default; do not uncheck it. If you are using a different application, please see the appropriate documentation to ensure you are properly embedding the ICC profiles.
Accessibility
Authors are strongly encouraged to prepare their color figures so that the use of color effectively conveys the point of the figure, while ensuring that color-blind readers will be able to distinguish the various colors used and fully comprehend the figure. The following resources can assist authors in accomplishing this goal:
“Somewhere over the rainbow: How to make effective use of colors in meteorological visualizations.” A BAMS article by Stauffer et al. (2015; doi:10.1175/BAMS-D-13-00155.1).
“How to make scientific figures accessible to readers with color-blindness.” An online post by Mary Spiro of The American Society for Cell Biology.
Location Names and Territorial Borders
The American Meteorological Society remains neutral with respect to land-based political borders and names or references to land-based locations in AMS journals. However, no borders or territorial boundaries should be shown over oceans and adjacent seas, gulfs, or other oceanic water bodies on figures in AMS publications.
Figure Sizing
AMS journals have standard widths for figures in our print journals and online PDFs (see table). In-figure text or other details may affect the final size. For example, AMS may set a figure larger than the standard width to ensure clarity. Alternatively, AMS may set a figure smaller than the standard width if there is less detail or if in-figure text is large. The height of a figure may also affect the final size. Other sizing exceptions exist.
Note that submitted figures may be at larger than the standard widths. This can be beneficial, for example, during the peer review process.
| Original width | Final width* | ||
|---|---|---|---|
| Picas | Inches | Centimeters | |
| One column | 19 | 3.2 | 8 |
| 2/3 page width | 27 | 4.5 | 11.4 |
| Two columns | 33 | 5.5 | 14 |
| More than two columns | 39 | 6.5 | 16.5 |
* Unit conversion: 1 pica = 0.167 in. or 0.423 cm.
Cover Image for BAMS
Authors interested in having their article featured on the BAMS cover should note that cover decisions are made by the Editor-in-Chief and graphics staff after a manuscript is accepted. Do not include a cover illustration during Peer Review.
Please note these general guidelines:
BAMS prefers unique, creative images that are compelling to a general audience as well as AMS members. The image should communicate its message at a glance. The editors work with the authors on a cover title applied to the image. The proposed graphic should be a single image, not a collage or a technical figure that one would normally find within an article. Keep in mind the proportions of the cover—the image should use the full page. Also be aware of areas reserved for the BAMS logo. Cover images cannot duplicate figures within the manuscript, cannot feature program or institutional logos, and cannot be cited in the text.
Also note that the cost for the BAMS cover is $2,150.00. This cost cannot be waived.
After your manuscript is accepted, please contact BAMS Managing Editor Bryan Hanssen if you are interested in suggesting a possible image for the BAMS cover.
Opening Page Image for BAMS
We are interested in images you feel would help the opening page make a stronger impression on readers (see examples in recent issues of BAMS). If you would like to suggest an image, please email it to BAMS Managing Editor Bryan Hanssen along with a description of the image and photo credit. Do not duplicate any of the other figures in the article. These images can greatly enhance the readership of your article.