-
- AMS_ClimateChange_168.jpg
-
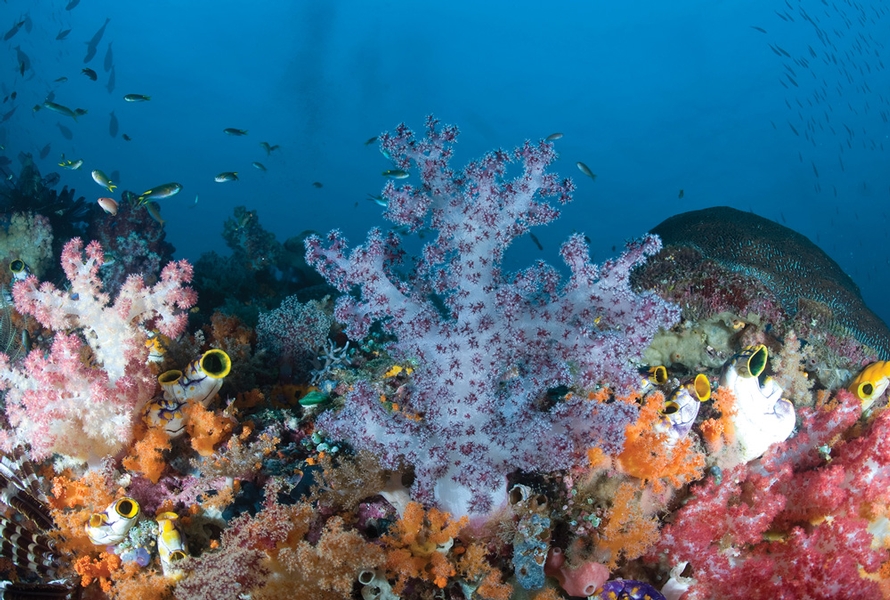
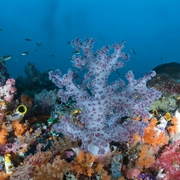
Rich, diverse, and vulnerable—abundant life on the coral reef. (UCAR Digital Image Library, photo by Kathy Krucker)
-
- AMS_ClimateChange_158.jpg
-
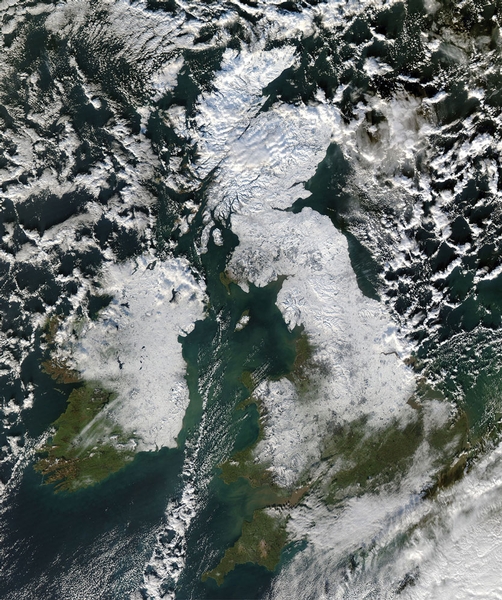
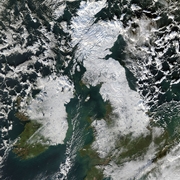
This image from NASA’s Moderate Resolution Imaging Spectroradiometer (MODIS) shows Britain encased in snow on January 7, 2010, midway through one of the harshest winters in recent times. (NASA Earth Observatory)
-
- AMS_ClimateChange_150.jpg
-
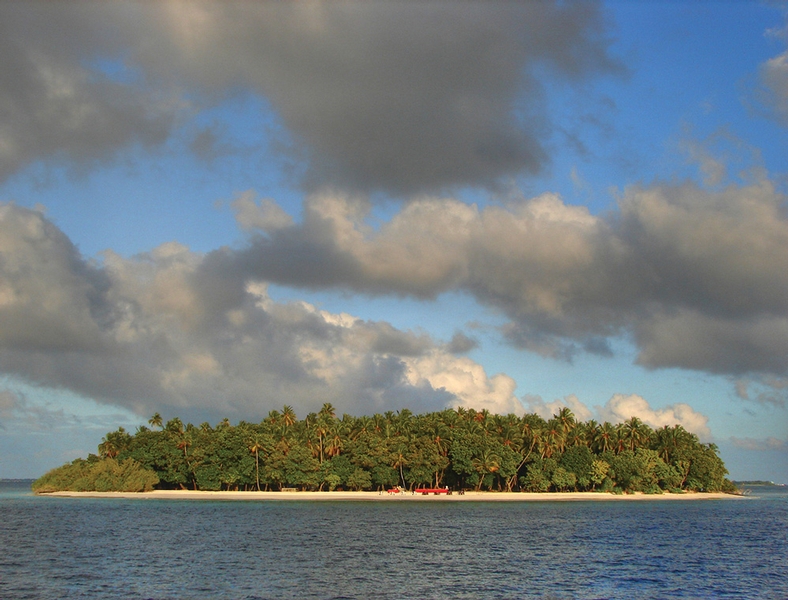
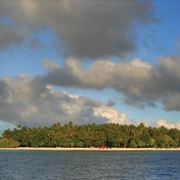
The Maldives lie uncomfortably close to sea level. (Nevit Dilmen/GFDL/www.gnu.org/copyleft/fdl.html/CC-BY-SA-3.0/Wikimedia Commons)
-
- AMS_ClimateChange_162.png
-
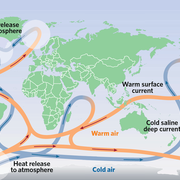
The great ocean conveyor belt.
-
- AMS_ClimateChange_143.jpg
-
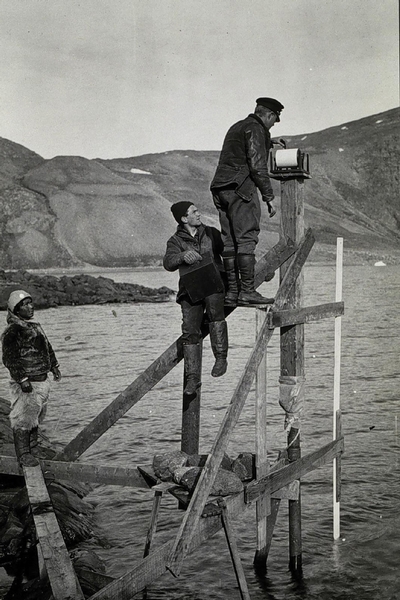
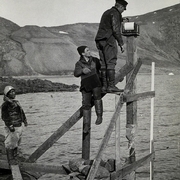
Members of a 1926 Arctic expedition check a tidal gauge at Etah, West Greenland. (NOAA/C&GS Season’s Report Rigg 1926–69)
-
- AMS_ClimateChange_154.jpg
-
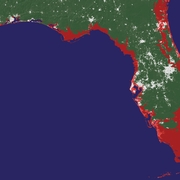
Parts of Florida susceptible to a 6-m (20-ft) rise in sea level are shown in red, with paler areas showing high-population zones. (Jeremy L. Weiss and Jonathan T. Overpeck, University of Arizona)
-
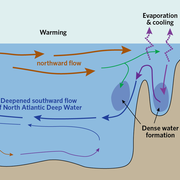
- AMS_ClimateChange_163.png
-
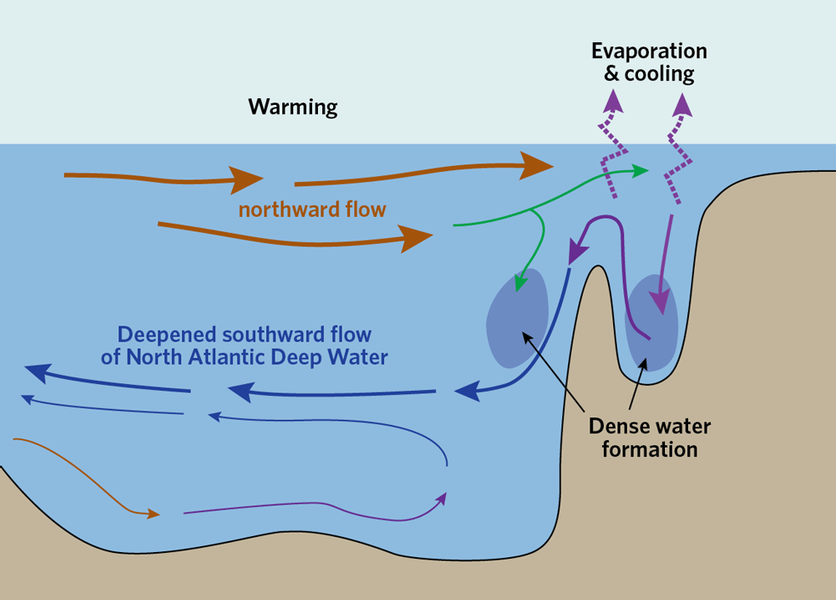
The Atlantic meridional overturning circulation shown in a vertical cross section extending from lower northern latitudes (left) to high latitudes (right).
-

- AMS_ClimateChange_147.png
-
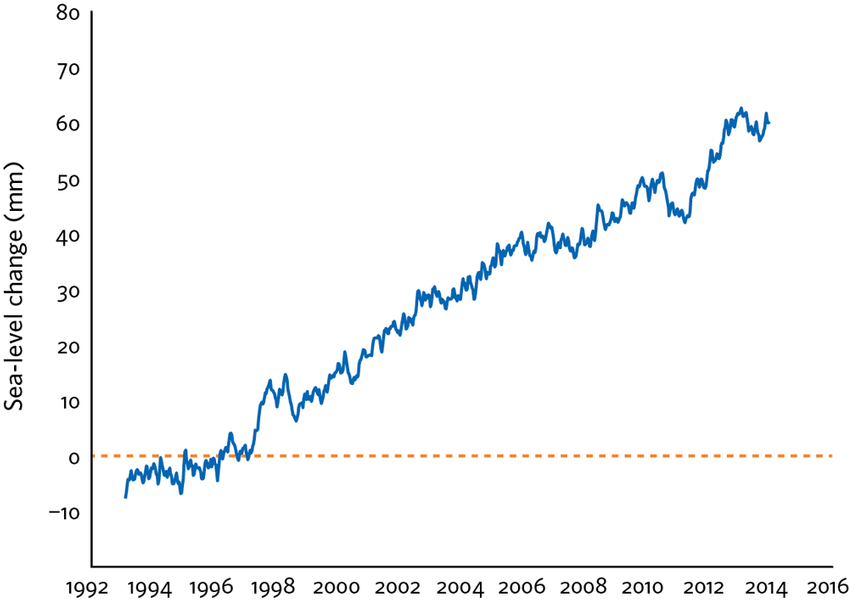
Sea level rise varies from month to month and year to year, but the long-term trend since 1993—shown here from satellite-derived data—is unmistakable, averaging about 3.2 mm per year. The normal seasonal cycle in sea level has been removed from this graphic. (Sea Level Research Group, University of Colorado Boulder)