-
- AMS_ClimateChange_135.jpg
-
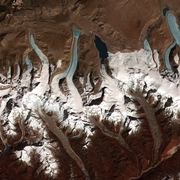
This image from NASA’s Terra satellite shows the termini of the glaciers in the Bhutan Himalayas. Glacial lakes have been rapidly forming on the surface of the debris-covered glaciers in this region during the last few decades. (NASA Earth Observatory)
-
- AMS_ClimateChange_134.jpg
-
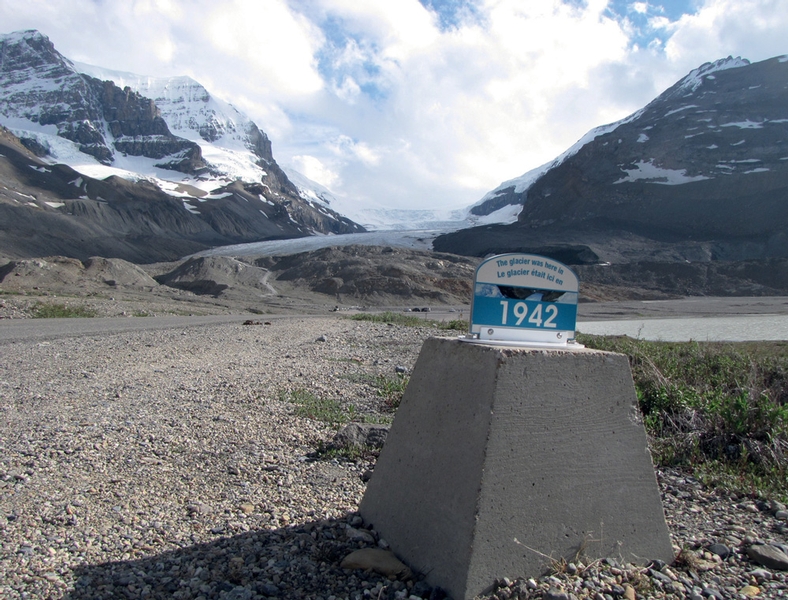
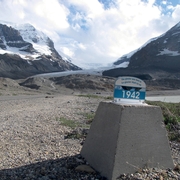
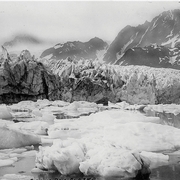
The Athabasca Glacier in Jasper National Park, Canada. The glacier currently recedes at a rate of 2–3 m (6.5–10 ft) per year and has receded more than 1.5 km (0.93 mi) in the past 125 years, as well as lost over half of its volume. (Robert Shepard)
-
- AMS_ClimateChange_139.jpg
-
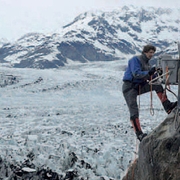
James Balog installs one of his ice-profiling cameras at the Columbia Glacier. (Tad Pfeffer/Extreme Ice Survey)
-
- AMS_ClimateChange_133b.jpg
-
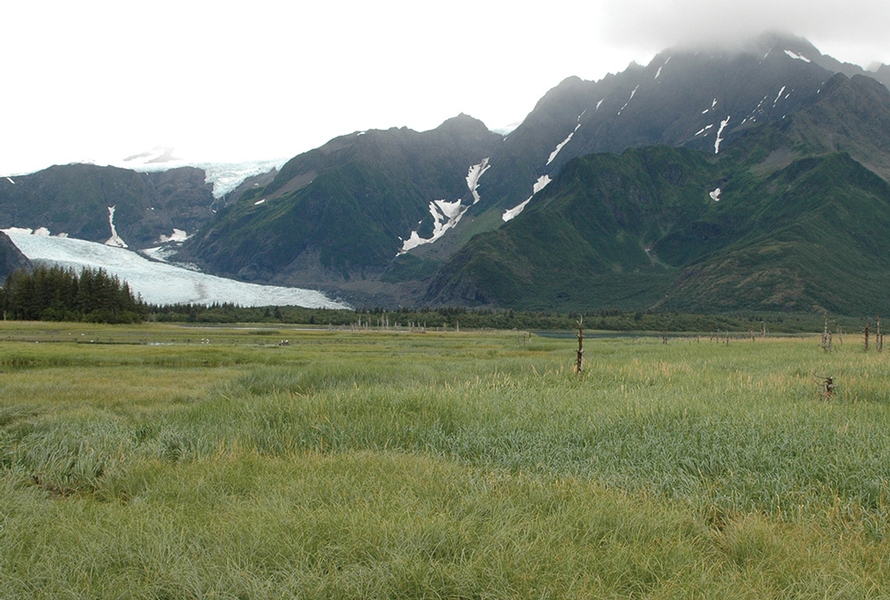
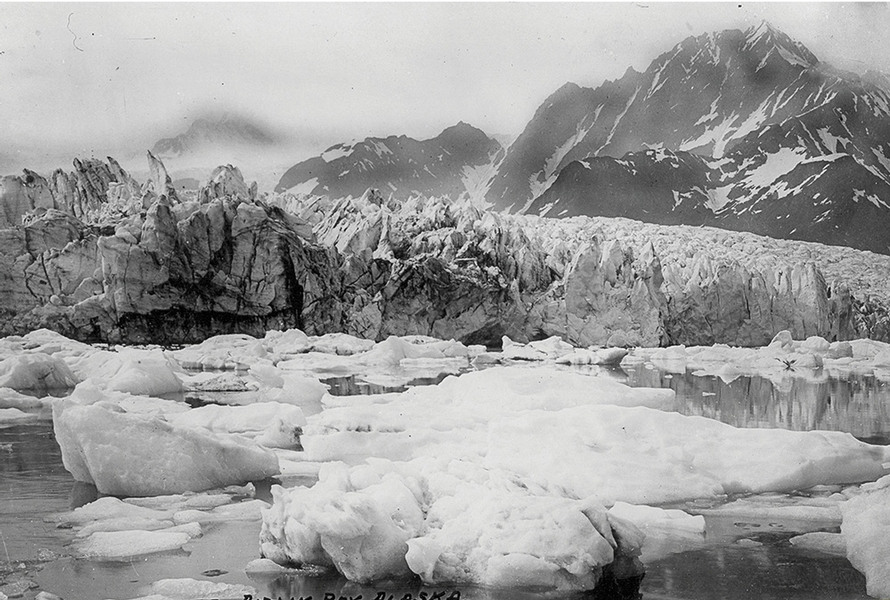
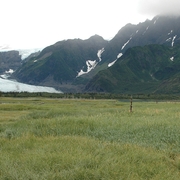
Landscape transformed: a lake at the foot of Alaska’s Pedersen Glacier in 1917 had become grassland by 2005. (Louis Pederson [1917]/Bruce Molina [2005]/National Snow and Ice Data Center)
-
- AMS_ClimateChange_129.jpg
-
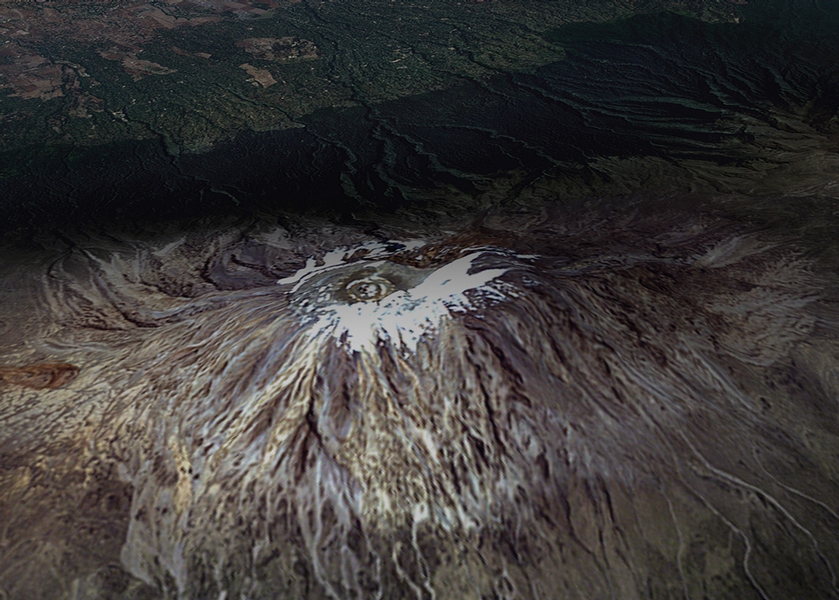
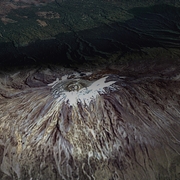
Mt. Kilimanjaro’s increasingly paltry cap of snow and ice, as viewed by satellite on -February 21, 2000. (NASA Earth Observatory)
-
- AMS_ClimateChange_127.jpg
-
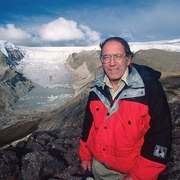
Lonnie Thompson with Qori Kalis Glacier, the largest outlet glacier from Peru’s -Quelccaya ice cap. (Thomas Nash)
-
- AMS_ClimateChange_123.jpg
-
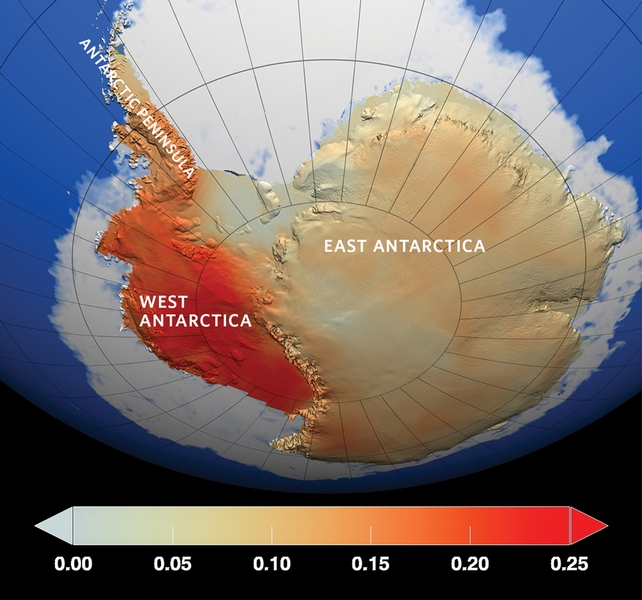
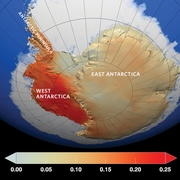
Red represents areas where temperatures have increased the most from 1957 to 2006, particularly in West Antarctica, where some points warmed even more than shown here. Temperature changes are measured in degrees Celsius. (Trent Schindler, NASA Goddard Space Flight Center Scientific Visualization Studio
-
- AMS_ClimateChange_121b.jpg
-
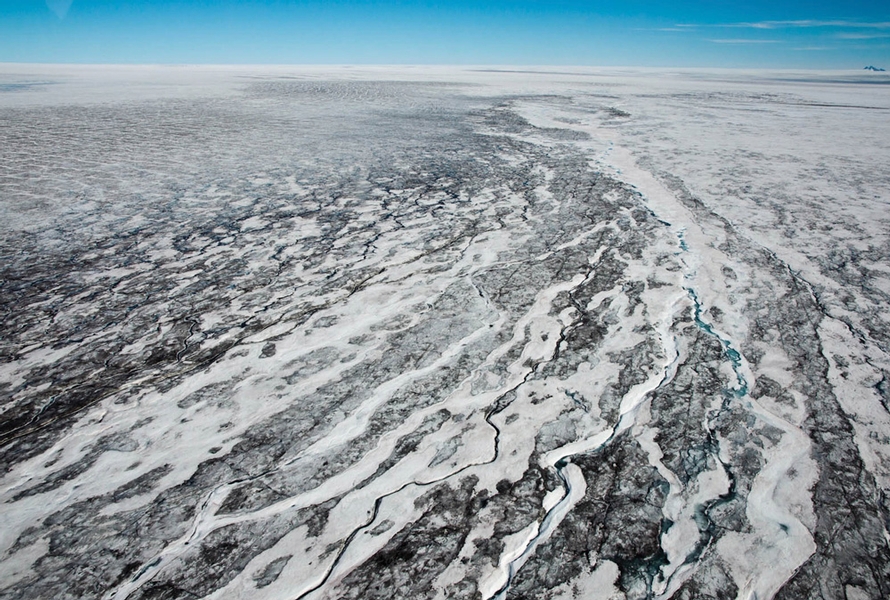
Soot and dust make their presence known atop ice fields in southern Greenland. (Jason Box/darksnowproject.org)
-
- AMS_ClimateChange_133a.jpg
-
Landscape transformed: a lake at the foot of Alaska’s Pedersen Glacier in 1917 had become grassland by 2005. (Louis Pederson [1917]/Bruce Molina [2005]/National Snow and Ice Data Center)
-
- AMS_ClimateChange_114.jpg
-
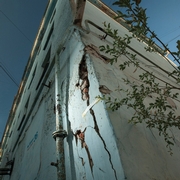
Hundreds of buildings in Yakutsk, Russia, have been compromised by permafrost instability, although construction practices are likely a factor as well. (Will Rose/-futureworldproject.org)
-
- AMS_ClimateChange_121a.jpg
-
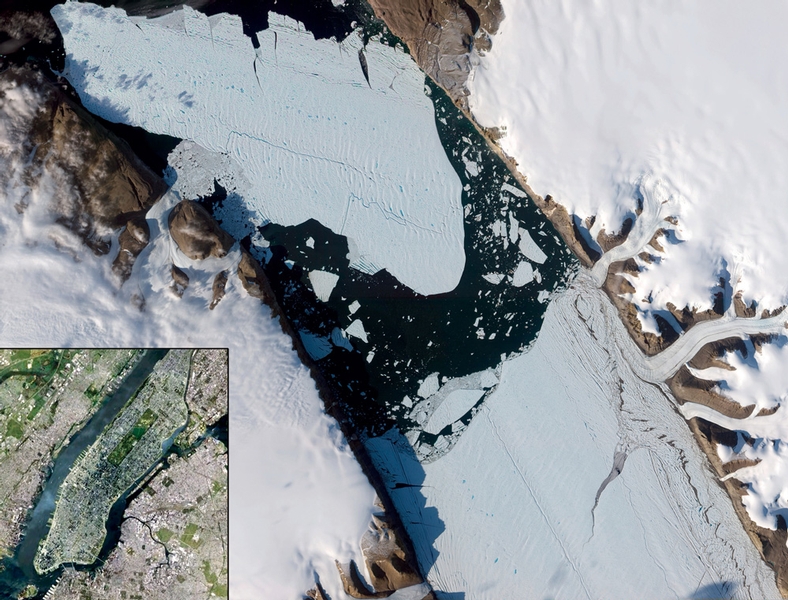
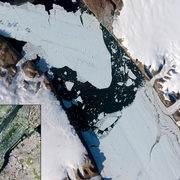
The cleaving of the Petermann “ice island”—satellite image of Manhattan to scale inset. (NASA Earth Observatory/U.S. Geological
-
- AMS_ClimateChange_115.jpg
-
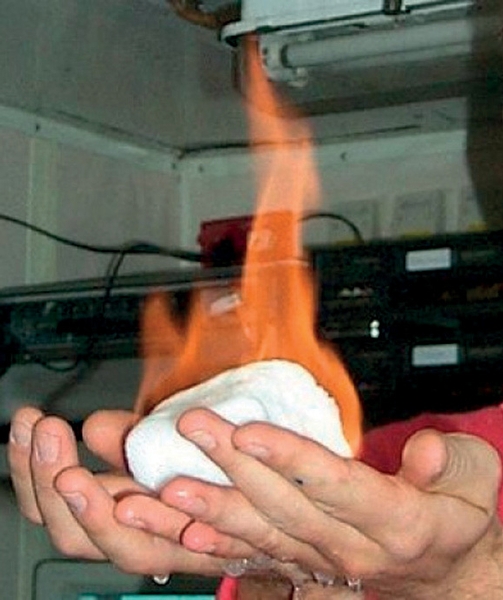
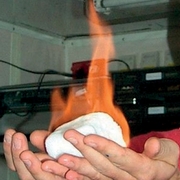
Gaseous methane burns off a lump of seabed -hydrate, releasing liquid water below. (Gary Klinkhammer)
-
- AMS_ClimateChange_119.png
-
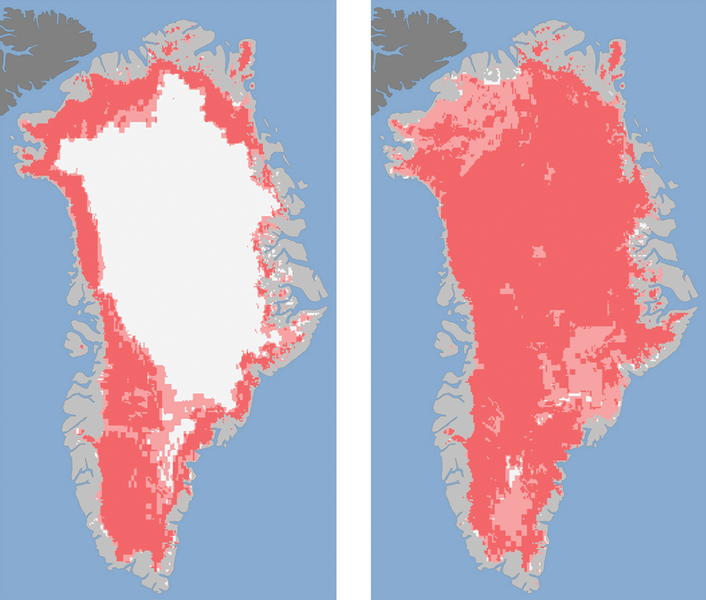
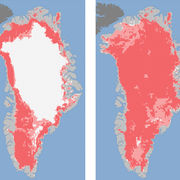
In 2012, surface thawing of the Greenland ice sheet (pink colors) exploded in extent from about 40% of the sheet on July 8 (left) to roughly 97% on July 12 (right). Areas in light pink (probable melt) show where at least one satellite detected surface melting, while the dark pink shows areas where at least two satellites detected melt. (Nicolo DiGirolamo, SSAI/NASA GSFC, and Jesse Allen, NASA Earth Observatory)
-
- AMS_ClimateChange_099a.jpg
-
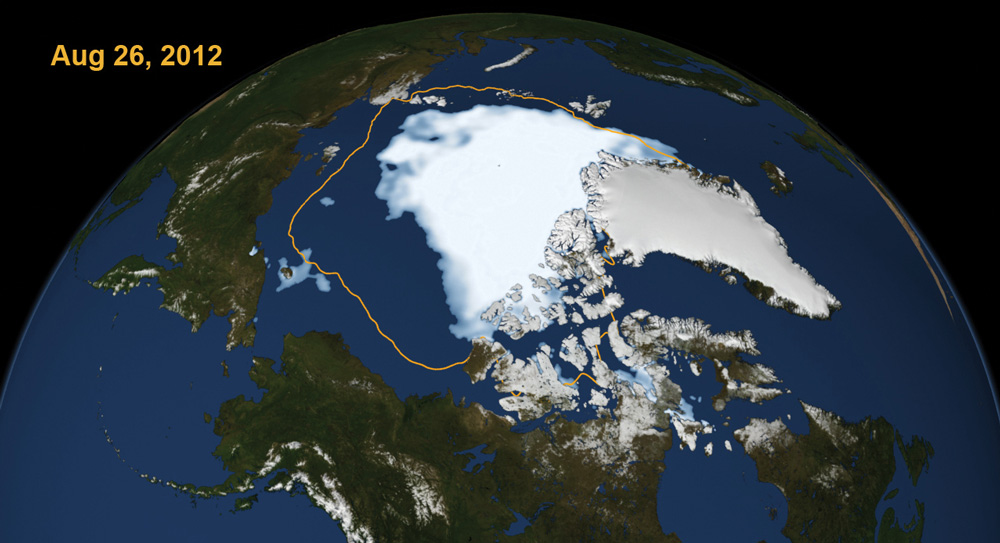
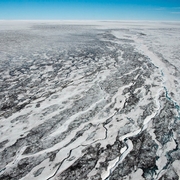
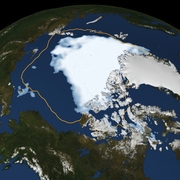
The yellow contour shows the average minimum extent for Arctic sea ice achieved each year from 1979 to 2010. Though the sea ice normally doesn’t reach its minimum until September, it had already shrunk to the lowest value on record by the time this satellite image was taken on August 26, 2012. (Scientific Visualization Studio)
-
- AMS_ClimateChange_099b.png
-
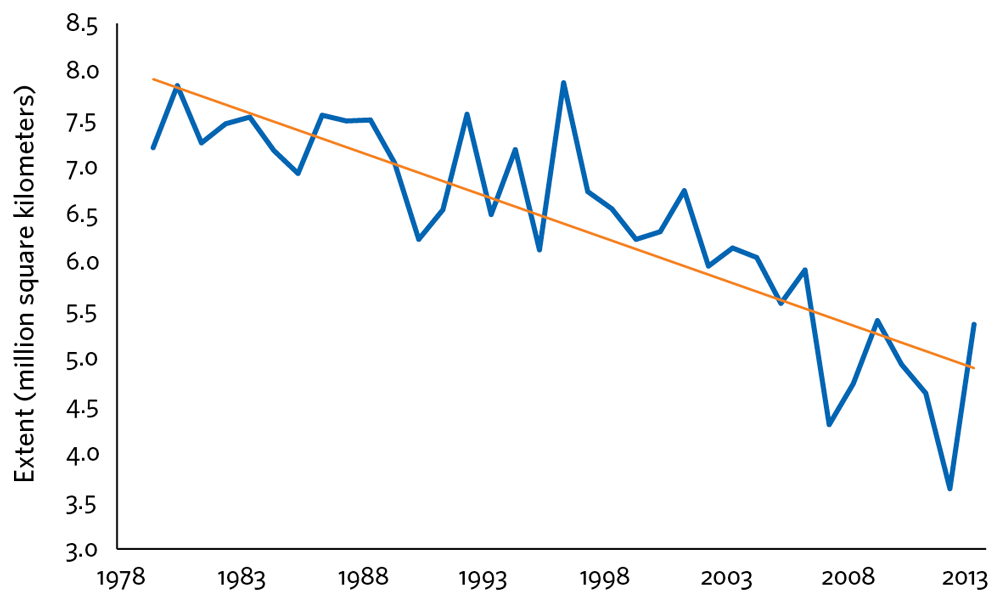
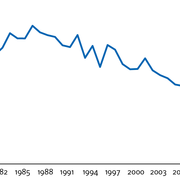
The typical extent of Arctic sea ice—averaged across September of each year, when the ice normally bottoms out—has plummeted during the last several decades, though not every year has shown a drop. (U.S. National Snow and Ice Data Center)
-
- AMS_ClimateChange_105.png
-
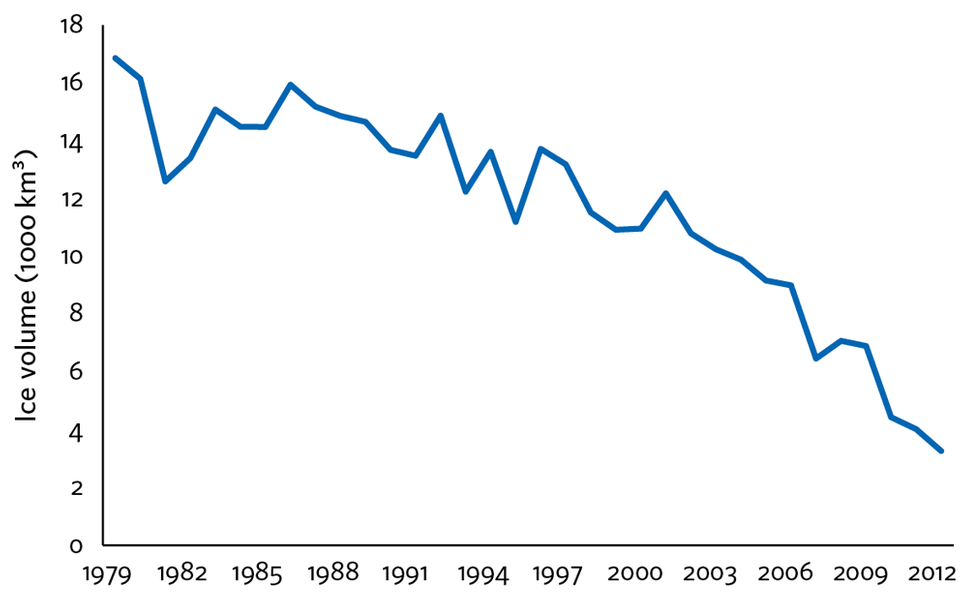
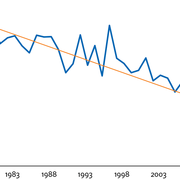
Until 2004, the volume of ice remaining at the last day of each melt season, as computed by the University of Washington PIOMAS model, topped 10,000 km³ each year. In 2012, that volume was a mere 3261 km³. If this pace of decline were to continue, the Arctic Ocean could be virtually ice-free at some point before 2020. However, many experts believe that the rate of ice volume loss will slow down before then. (PIOMAS/University of Washington)