-
- AMS_ClimateChange_318.jpg
-
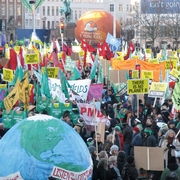
Protestors flock to central Copenhagen as the UN Conference of Parties opens, December 2009. (Robert Henson)
-
- AMS_ClimateChange_301.jpg
-
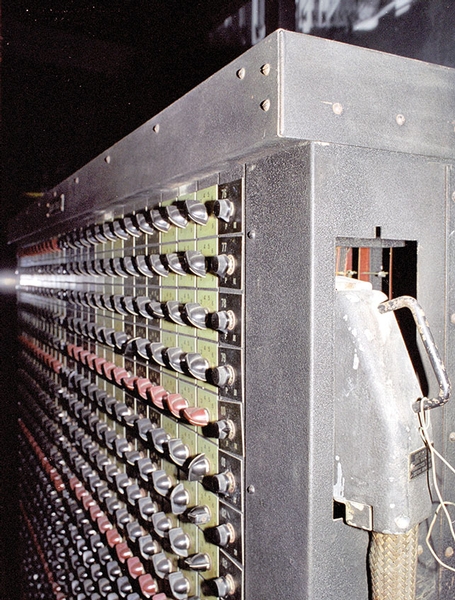
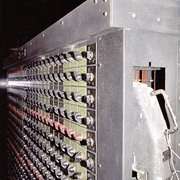
A function table from ENIAC, now housed in a museum. (Jud McCranie/Wikimedia Commons)
-
- AMS_ClimateChange_304.jpg
-
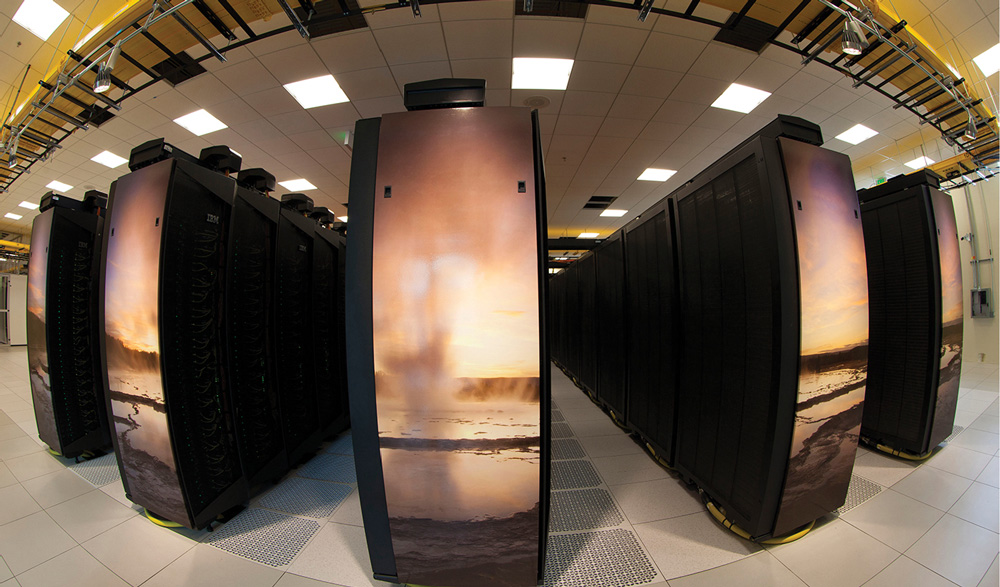
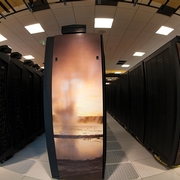
This IBM machine, dubbed Yellowstone, is located at the NCAR-Wyoming Super-computing Center in Cheyenne. It can carry out more than one quadrillion calculations per second. (UCAR)
-
- AMS_ClimateChange_314.jpg
-
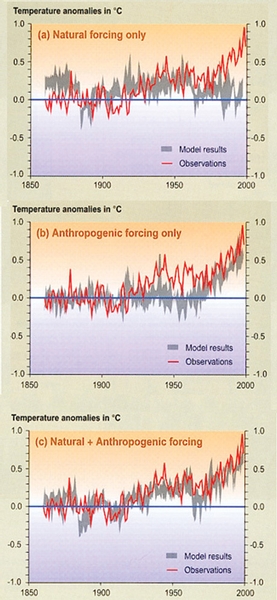
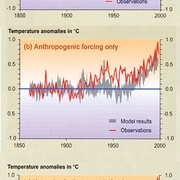
When models look only at natural climate forces (top) or human-produced ones, such as greenhouse gases and sulfate pollution (middle), they fail to accurately reproduce the last century’s climate (the red line in each graph). A model that incorporates both kinds of forces (bottom) does a much better job. The gray shading shows the range of each model ensemble. (IPCC)
-
- AMS_ClimateChange_302.png
-
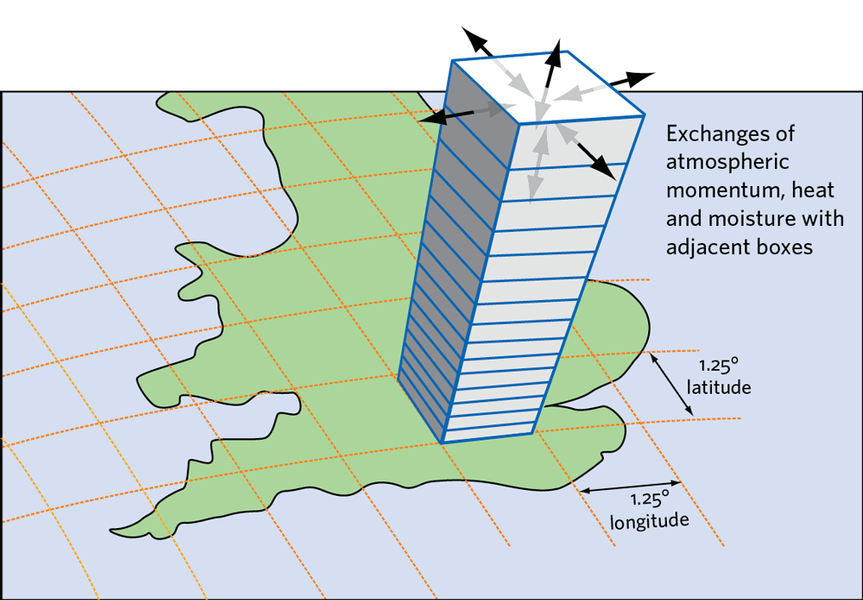
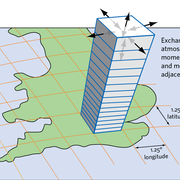
A climate model divides the atmosphere into 3-D chunks and measures the change in each one as weather unfolds over days, years, and decades of model time.